Blog

Profiling the three carbon pricing bills before the MA Legislature

Three different carbon pricing bills with significant numbers of co-sponsors were introduced to the Massachusetts Legislature earlier this session after similar attempts had been ground to a halt in previous years. By February 2018, the Joint Committee on Telecommunications, Utilities and Energy, which held a hearing on the bills in June 2017 and in whose court the ball is right now, has to make its recommendations to the Legislature.

In light of the tight timeline for the decision to be reached and the likely importance of the pricing tool in the arsenal of the State to reach its post-2020 emission reduction goals, the differences among the bills warrant closer attention.

In this post, I will summarize the main differences of the bills by Senator Barrett (S.1821), Senator Pacheco (S.1869) and Representative Benson (H.1726) along the main design dimensions of carbon pricing schemes that were first summarized by Brookings senior fellow Adele Morris.

Read More

Leveraging Open Data for Climate Resilience Planning in Boston

Prioritizing cost-effective green infrastructure interventions in South Boston

Boston’s largest waterside park, the Joseph Moakley Park, separating South Boston from Dorchester, is currently undergoing a comprehensive planning review that seeks to address the area’s growing vulnerability to stormwater and flooding events. Last year’s much heralded Boston Climate Adaptation report warned that the low lying topography of the park and flanking I-93 provides a critical flooding pathway from Dorchester Bay exposing land-inward neighborhoods including South Boston and the South End.

Modeling flooding probabilities around Joseph Moakley Park

The modeling results below, which I generated with a new tool from the Trust for Public Land, illustrate exemplarily that by 2070 the chances are 10-50% in any given year that the immediate areas around Joseph Moakley Park (signified by red dot on map below) are flooded. This corresponds to an average flooding recurrence interval of every 2-10 years for those areas colored light purple (on average every 10 years) to azure-blue (on average every 2 years).

Read More

My Research: Political Barriers to Solar PV in Florida – Local strategies (3/3)

Thesis_Barriers_Solar_Florida

Note: This is Part 3 of a three-part series of blog posts that delve into the findings of my thesis research. Part 1 outlined the key insights from the research. In the second part I dug a bit deeper into the individual policy and regulatory barriers and described their impacts. Part 3 now explores strategies at the county and city level to deploy more solar within the prevailing policy framework.

Florida: sub-state level

The expert interviews with county and city-level officials from Florida , together with solar company representatives , working across the state shine light on proven pathways to greater solar adoption (click here for interviewee list). They are already taking steps within the existing legislative and regulatory framework. This post showcases some policy tools that interviewees suggest hold potential for boosting further solar PV growth in the state leveraging financing models, solar discounts, measures to overcome soft barriers and sub-state policy coordination.

Read More

My Research: Political Barriers to Solar PV in Florida (2/3)

Thesis_Barriers_Solar_Florida

Note: This is Part 2 of a three-part series of blog posts that delve into the findings of my thesis research. Part 1 gave a top-level overview of the main findings. Part 3 will explore strategies at the county and city level to deploy more solar within the prevailing policy framework.

Policy and regulatory barriers to solar PV

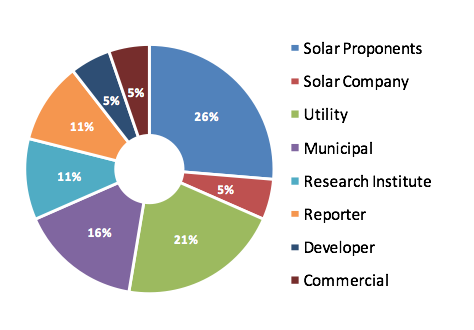
In this post I will highlight the main policy and regulatory barriers to greater solar PV adoption in Florida based on conversations with 19 experts familiar with the solar industry in the state. My objective is to illustrate the areas of consensus and, at times, ardent disagreement among key stakeholders. I spoke to representatives from the utility sector, solar advocates and solar companies, municipal and county government officials, journalists and researchers as well as the commercial sector (click here to see more detailed breakdown).

To recap: in my previous post I introduced the following table detailing the main solar PV barriers evoked by the different interviewees. The remainder of the piece will dig a bit deeper into the barriers mentioned for which there is disagreement among experts and/or the expert interviews shed a different light on the importance of a specific barrier compared to my preliminary desk research.

Read More

My Research: Political Barriers to Solar PV in Florida – Results (1/3)

Thesis_Barriers_Solar_Florida

Note: This is Part 1 of a three-part series of blog posts that delve into the findings of my thesis research. Part 2 and 3 will be released over the course of next weeks and will feature a more close-up look at the policy barriers and explore strategies at the sub-state level to deploy more solar.

Summary of Results

When it comes to solar PV adoption, Florida has been called many names: laggard, slow-mover, a big disappointment or outright hostile. In 2016, these characterizations faced their first test as two ballot initiatives about solar rights/restrictions and solar system tax treatment battled for the hearts and minds of Floridians, who saw themselves tossed in the middle of solar advocates on the one side and the utility camp on the other. The two ballot initiatives shined a light on a couple of high-profile policies such as solar leasing, net metering, solar charges and tax exemptions that co-determine the incentives to deploy more solar in the state. Still, there are a range of equally, if not more, consequential policies that shape the investment incentives that feature less prominently in the public’s mind but warrant greater attention.

This research takes a more comprehensive view at policies and aims to disentangle Florida’s political barriers to solar PV, defined as any legislative or regulatory disincentives to deployment, and assesses their respective weights in slowing greater solar adoption. Second, it explores the underlying reasons for their existence and, third, identifies strategies sub-state actors such as counties and cities use to stimulate solar within the existing state-level policy framework.

Thesis_Interviewees

Overall interviewee breakdown by sector (n=19)

In this endeavor, the theoretical and empirical literature on barriers to renewables provides a scaffold for a total of 19 semi-structured expert interviews with industry experts, and county-and city-level officials representing both sides of the argument. The interviewees provided their assessment of the biggest political obstacles and reasons underlying them, which are then presented in aggregate alongside the findings distilled from secondary research. County-and city-officials provided best practices in incentivizing deployment at their level of government.

Read More

Municipal Collaboration on Coastal Climate Change Adaptation

Banner_Municipal Collaboration Climate Adaptation Mass

Picture Credits (all Flickr, occ. cropped, left to right): Jasperdo, Doug Kerr, Robert Linsdell, cmh2315fl, massmat , Jennifer Macaulay, Tom Whitten

Constraints and Opportunities for North and South Shore municipalities in Massachusetts

Municipalities_MA

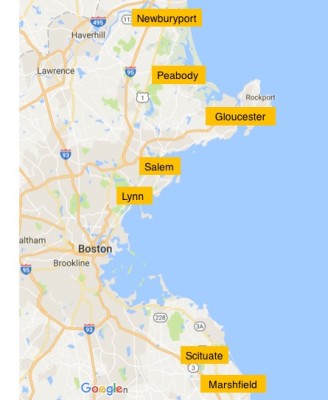
This research looks at coastal adaptation capacity constraints and collaboration opportunities of Massachusetts coastal municipalities from Newburyport in the north and Marshfield in the south (see right for map of included municipalities). Thematically, it is concerned foremost with the effects of both sea level rise and extreme weather events on coastal infrastructure and ecosystems in the region. Building on 21 conversations with municipality representatives, nongovernment conservation groups, Commonwealth departments and agencies and many more, it sets out to answer the following three questions: 

  • What are the greatest constraints at the municipal level to implement coastal adaptation strategies?
  • Is there potential for greater inter-municipal collaboration on adaptation? If yes, on which issues?
  • Which stakeholders should be included to in these collaborations?

Read More

Visualization: Customer-owned solar in Florida

Solar Panels_Alachua County_Florida

Research on the political barriers to solar PV deployment in Florida

As part of my thesis research on the obstacles to greater solar PV in the ‘Sunshine States’ ‘ energy mix I have spent the last couple of weeks scrapping, cleaning and harmonizing data on customer-owned (behind the meter) generation capacity of renewables in Florida. In Florida, investor-owned utilities (IOUs), municipal utilities and rural electric cooperative are legally bound to report the data yearly to the Florida Public Service Commission (e.g. click here for the aggregate 2015 Net Metering Report).

The dashboard below takes a first step toward unlocking the wealth of information that is buried in these reports. It maps the capacities by individual Florida county, breaks down new interconnections over time and disaggregates net metering capacity by utility that customers contract with. My work is supervised by Prof. Flachsland at the MCC and supported by the Environmental Defence Fund.

Read More

Own Research: Working Poverty in the United States (2005-2013)

Bills

Picture Credits: Erich Ferdinand, Cropped Picture, Flickr

Situating own research on male, old-age working poverty in a broader context

Working poverty in the United States has many faces. More often than not it still has the face of a woman, the face of a person from an ethnic or racial minority or someone who left schooling after high school. But this hardly captures the diversity of people whose unifying characteristics are the struggle to get by until the next paycheck arrives and the fear of any unforeseen expenditures that could upend the budget for the month. Working poverty sits squarely, uncomfortably in the middle of America’s society – a recognition that dawns on some only because it now also more often than before has the face of White man.

Still, the fact that for every tenth person (or more depending on the measures chosen) in the entire population work doesn’t secure one’s living anymore doesn’t seem to have registered with most people. Working poverty is corroding the trust that for those whose bodies allow decent work pays for a decent living, that you are not reliant on the government to put food on the table or pay the rental bill.

Motivated by the relatively sparse research attention devoted specifically to male, old-age working poverty in the U.S. and its symbolic role in raising society-wide awareness about the problem of working poverty, I traced the evolution of working poverty rates in between 2005 and 2013. In times when federal low-income supports such as SNAP (food stamps), rental assistance and Medicaid are under siege, I further isolated the effect of government transfers on poverty rates. But before presenting some of my findings it is worthwhile to put its troubling snapshot of nine years into a broader perspective, both thematically and historically.Earlier this month, two independent research teams from published findings, which nicely set the stage.

Read More

Framing Geopolitics: Environmental Impacts of Shale Boom

Shale gas wastewater storage pond, Pennsylvania USA

Picture  Credits:  Max Phillips (Jeremy Buckingham MLC), Flickr

Russian and Chinese online media coverage of fracking

As one of its last actions under the current administration, the U.S. Environmental Protection Agency (EPA) released its final assessment report on the potential impacts of hydraulic fracturing for oil and gas on U.S. drinking water resources earlier last month. Its reception in the media exemplifies the contesting messaging in the environmental domain by fracking advocates and its critics.

At the same time, its coverage in foreign media outlets illustrates select findings of my own research on the Russian and Chinese news coverage of the U.S. shale boom, which I conducted at the Hertie School of Governance over the past months. 

Read More

Who is swayed by it? – EDF Action and LCV’s ad campaign in PA

Since July of this year, EDF Action and the League of Conservation Voters (LCV) have jointly poured USD 1.5 million in support of Katie McGinty’s (D) bid for Pennsylvania’s Senate seat. Polls are showing McGinty and  incumbent Senator Toomey (R) head-to-head, but – depending on which poll you trust most - around 20% of likely voters are still unsure of whom to vote for. Among the group of undecideds, women and ideologically moderates and independents are most likely to have not made up their minds about the candidates yet.

Read More