
Own Research: Working Poverty in the United States (2005-2013)

Picture Credits: Erich Ferdinand, Cropped Picture, Flickr
Situating own research on male, old-age working poverty in a broader context
Working poverty in the United States has many faces. More often than not it still has the face of a woman, the face of a person from an ethnic or racial minority or someone who left schooling after high school. But this hardly captures the diversity of people whose unifying characteristics are the struggle to get by until the next paycheck arrives and the fear of any unforeseen expenditures that could upend the budget for the month. Working poverty sits squarely, uncomfortably in the middle of America’s society – a recognition that dawns on some only because it now also more often than before has the face of White man.
Still, the fact that for every tenth person (or more depending on the measures chosen) in the entire population work doesn’t secure one’s living anymore doesn’t seem to have registered with most people. Working poverty is corroding the trust that for those whose bodies allow decent work pays for a decent living, that you are not reliant on the government to put food on the table or pay the rental bill.
Motivated by the relatively sparse research attention devoted specifically to male, old-age working poverty in the U.S. and its symbolic role in raising society-wide awareness about the problem of working poverty, I traced the evolution of working poverty rates in between 2005 and 2013. In times when federal low-income supports such as SNAP (food stamps), rental assistance and Medicaid are under siege, I further isolated the effect of government transfers on poverty rates. But before presenting some of my findings it is worthwhile to put its troubling snapshot of nine years into a broader perspective, both thematically and historically.Earlier this month, two independent research teams from published findings, which nicely set the stage.
Thomas Piketty, Emmanuel Saez and Gabriel Zucman show in their working paper, which uses a promising, new approach to estimate the distribution of income in the United States, that the pre-tax incomes of the lower 50% of the income distribution have stagnated for the working-age population since 1980 (see Figure 1 below, left panel).
Adjusted for inflation, an individual in the bottom half of the income distribution only makes around USD 16,000 per year in 2013, the same amount as three decades ago. For those aged 45-60 years, the data indicates a pre-tax income drop of 8% over the entire period, while those between 20 and 45 years make on average 20% less in 2013 than in 1980. Taxes and government transfers were largely powerless to turn the tide of the trend, the incomes for both demographic groups post-tax have only minimally increased. Only senior citizens have seen their income rise by more than 50% (see Figure 1 below, right panel).
Figure 1: Pre- and post-tax incomes for bottom 50%, by age group (Piketty et al. 2016 )
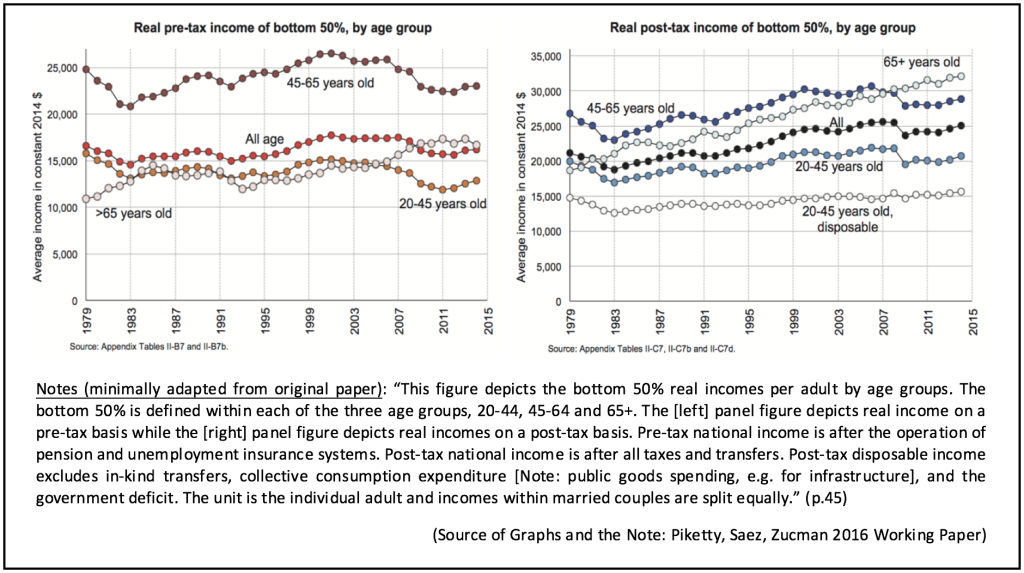
If the same data is sliced along gender lines, the researchers find that for working-age men the median, pre-tax labor income has plummeted to the same level as in 1980 after several cyclical swings. Most notably, the Recession roughly chipped away USD 7,000 from the median male pre-tax labor income in between 2007 and 2010. Government transfers cushioned the drop preventing the income from falling even more.
While the results from Piketty and colleagues are already bleak, the research from the Equality of Opportunity Project released at about the same time this month made headlines (e.g. here or here) for poignantly expressing the conditions through one indicator: the rapidly declining share of children in the U.S., who earn more than their parents.
According to Chetty et al. this measure, also called absolute mobility, “fell in all 50 states between the 1940 and 1980 cohorts, although the rate of decline varied, with the largest declines concentrated in states in the industrial Midwest states such as Michigan and Illinois.” For the industrial Midwest this steep decline means that close to every second person born in 1980 earns less than their parent’s generation. Importantly, the authors also demonstrate that the general trend is largely insensitive if all government taxes and transfers are included.
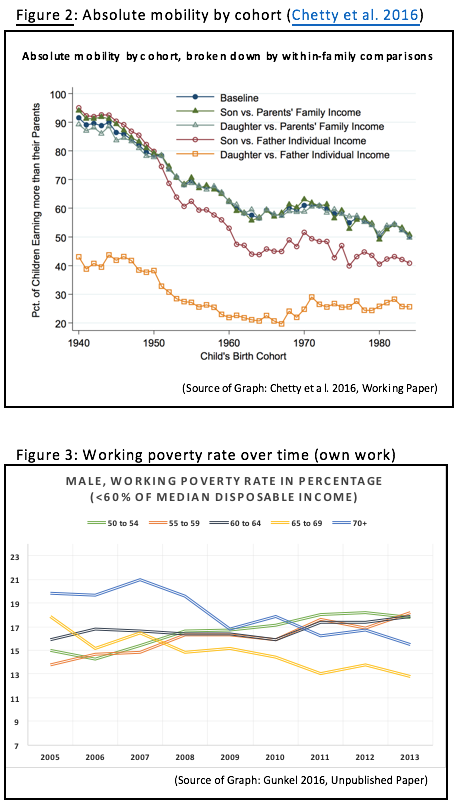
If the incomes of sons and their fathers is compared (see Figure 2, red circle-plot line) the decline is even more pronounced. The trough of the “son vs. father” line sets in with the early 1960 cohorts meriting a closer look at those men, who are now in their 50ies. My research focuses on exactly this demographic, but looking only at those, who are in part-time or fulltime employment.
If the individual poverty threshold is set at slightly below USD 17,000 per year (equiv. to 60% of median disposable income (DI); data from ASEC CPS), then I find that working poverty rates have increased from 2005 to 2013 for men aged 50-54 years, 55-59 years and 60-64 years (see Figure 3). Similar results are obtained when a 50% or 70% threshold is chosen.
More specifically, the working poverty rate of men between 50 and 54 increased by 20%, while the rate of the 55-59 year olds increased by a third. The data alone cannot tell anything about the underlying reasons for this trend, but the above outlined male wage trends and persistent underemployment in higher ages. Higher labor force participation in the higher sixties and changes to the amounts of money social security benefit-receiving seniors may earn, could explain the falling rates for men above 64.
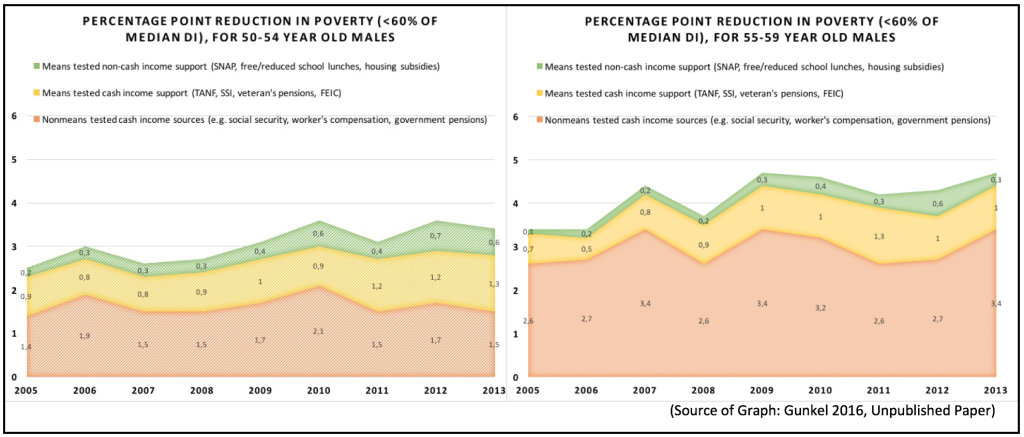
Finally, the Current Population Survey data also clearly indicates that in 2013 all federal income sources together (means tested cash (& non-cash) income support and nonmeans tested income sources) lifted 20-36% more people out of poverty across the five age brackets than in 2005. While social security and unemployment benefits remain most effective in reducing working poverty, the government-provided income support has grown in importance. Exemplary, Figure 4 below shows the poverty reduction by federal income source for men aged 50-54 and 55-59.
Figure 4: Poverty reduction by federal income source for 50-54 and 55-59-year-old men (own work)
For policy-makers, the growing incidence of working poverty, especially among males in their fifties, and the accompanying lower social security contributions should be a warning sign. It is important to acknowledge that even though there is a clear role for low-income supports to play as the research has indicated, government transfers cannot nearly do the job alone. Both recently published research papers speak to this.
Piketty and colleagues call for a greater emphasis on redistributing primary assets such as education, bargaining power and financial capital in the face of three decades in which government transfers and taxes were largely powerless against the vastly growing inequities in the distribution of income. To see how such changes could improve absolute mobility in the U.S. Chetty et al. calculate that under a more broadly-shared income growth scenario such as in the 1940s around 70% of the mobility gap between the 1940s and 1980s could have been closed.
It is an astounding result, which has the power to frame the agenda for the years to come and to mobilize politicians and civil society alike to hold the upcoming administration to account.