
Leveraging Open Data for Climate Resilience Planning in Boston
Prioritizing cost-effective green infrastructure interventions in South Boston
Boston’s largest waterside park, the Joseph Moakley Park, separating South Boston from Dorchester, is currently undergoing a comprehensive planning review that seeks to address the area’s growing vulnerability to stormwater and flooding events. Last year’s much heralded Boston Climate Adaptation report warned that the low lying topography of the park and flanking I-93 provides a critical flooding pathway from Dorchester Bay exposing land-inward neighborhoods including South Boston and the South End.
Modeling flooding probabilities around Joseph Moakley Park
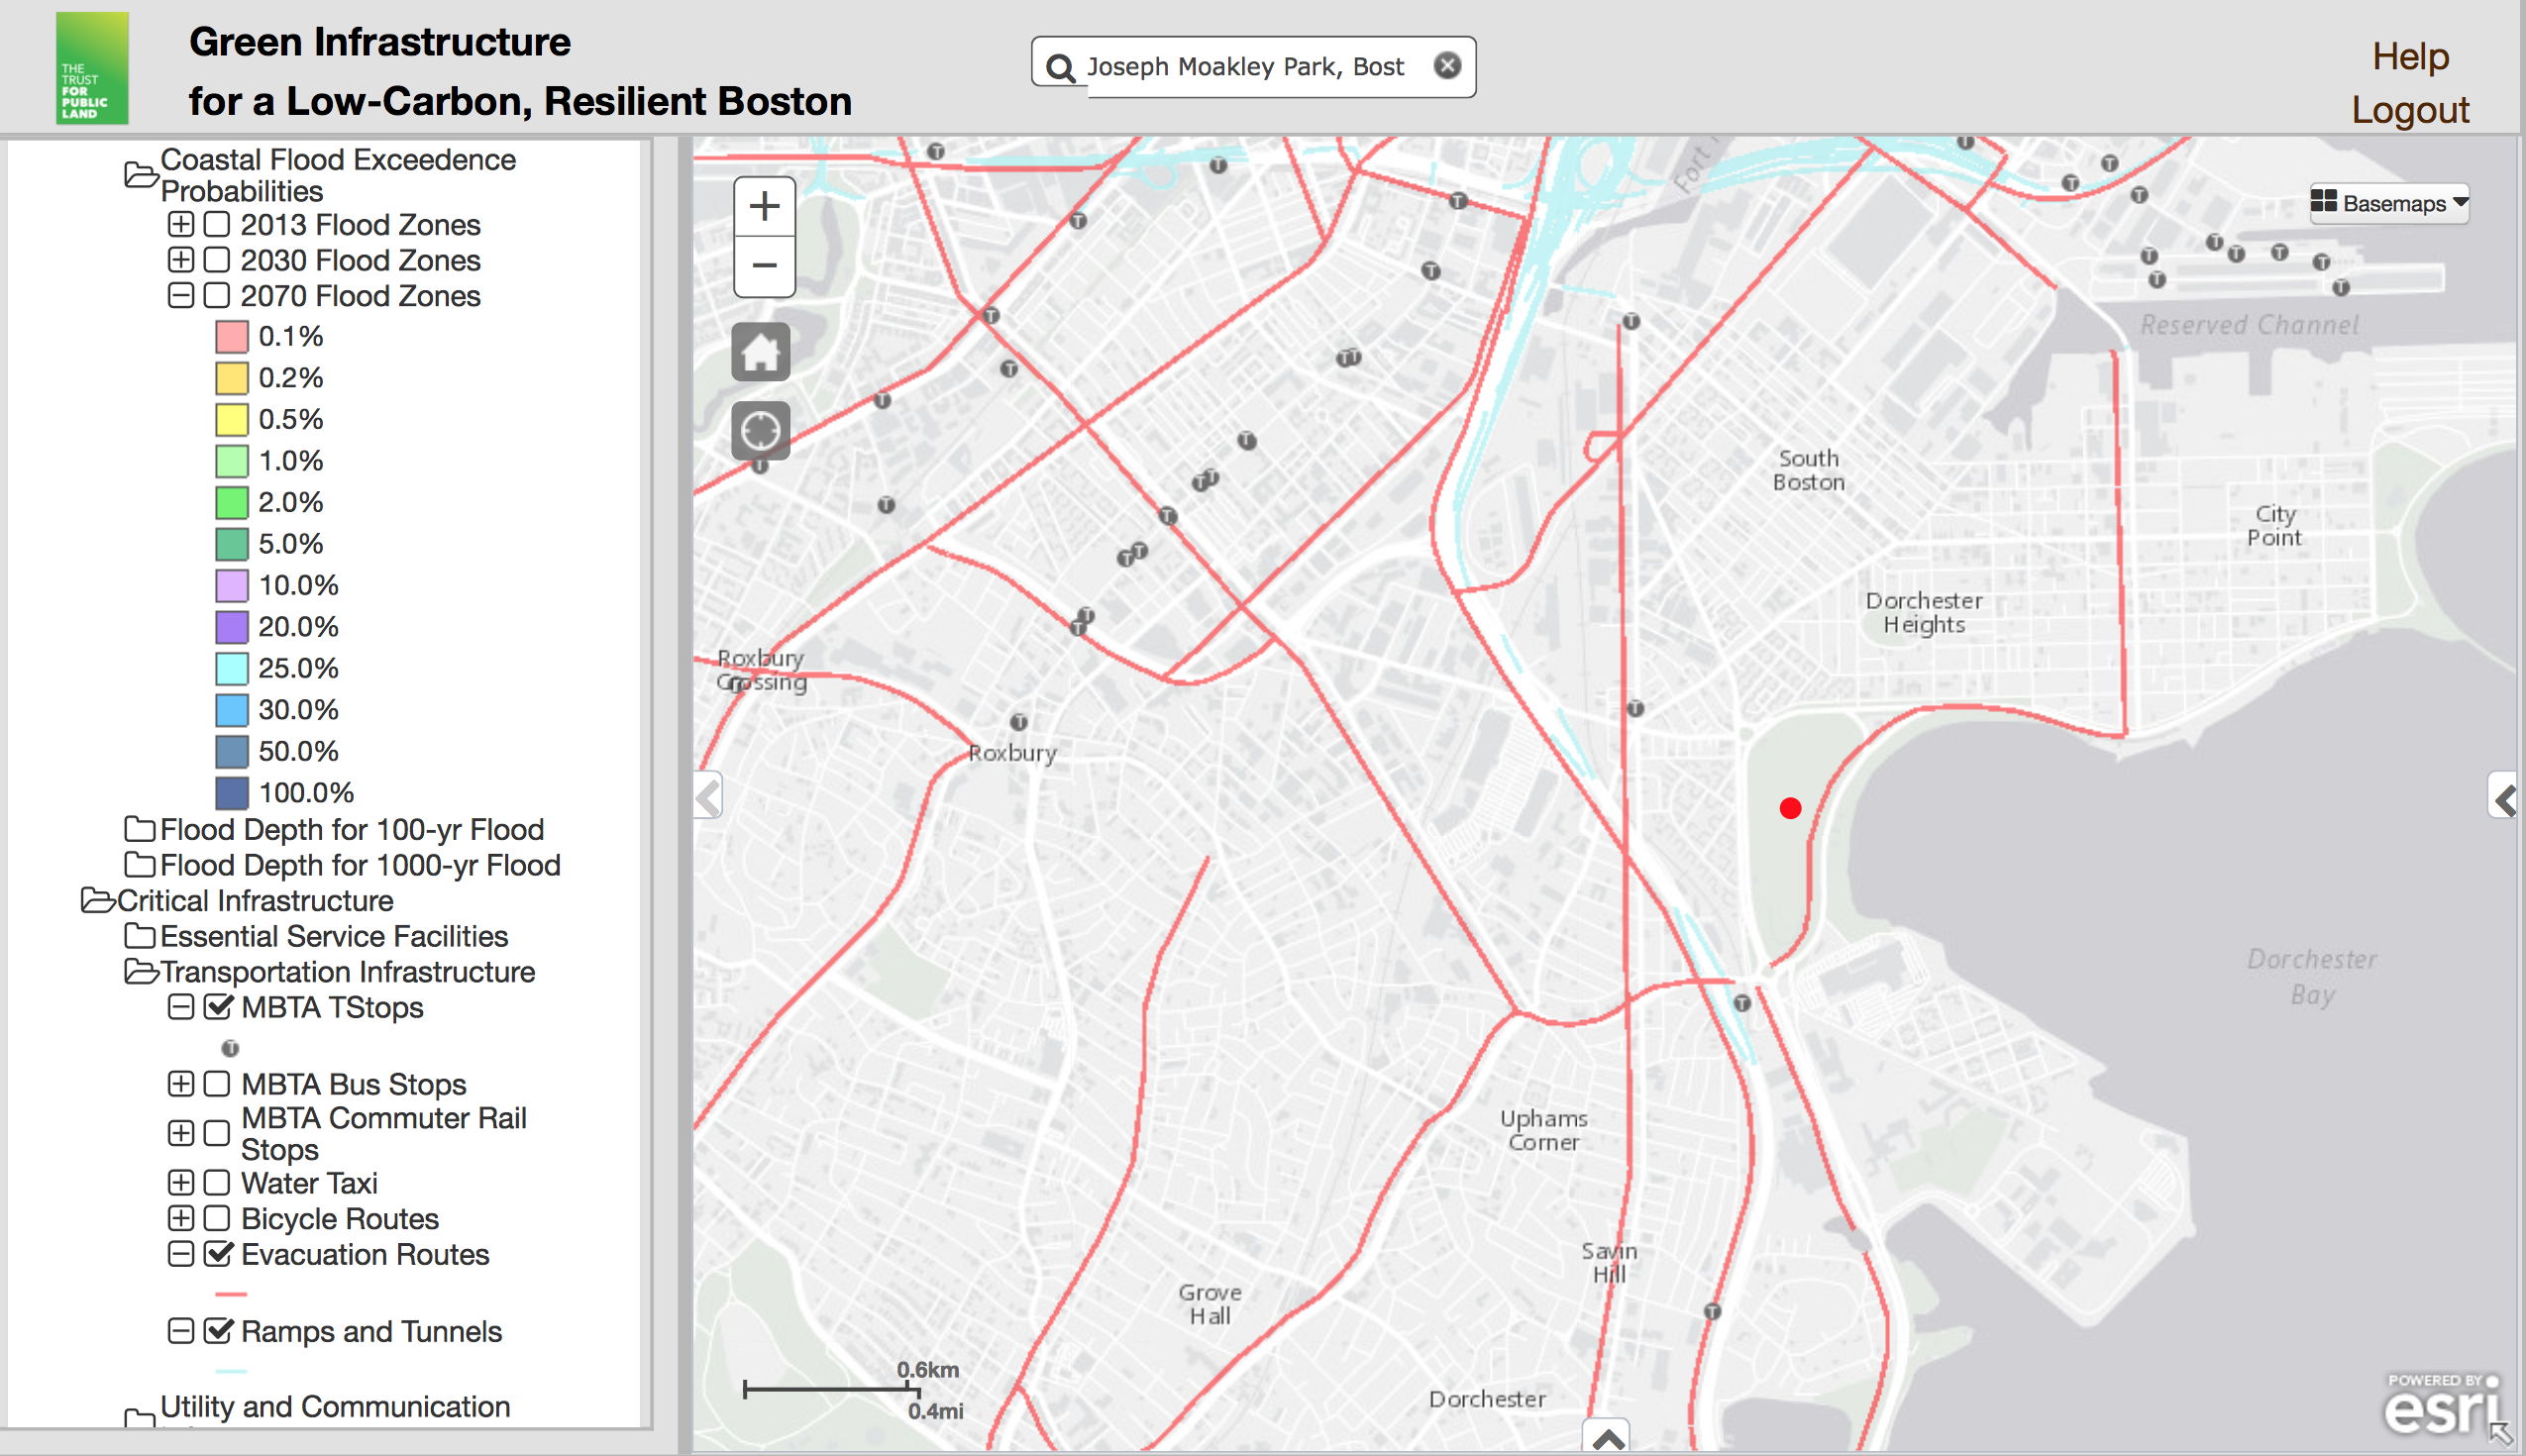
The modeling results below, which I generated with a new tool from the Trust for Public Land, illustrate exemplarily that by 2070 the chances are 10-50% in any given year that the immediate areas around Joseph Moakley Park (signified by red dot on map below) are flooded. This corresponds to an average flooding recurrence interval of every 2-10 years for those areas colored light purple (on average every 10 years) to azure-blue (on average every 2 years).
Furthermore, critical infrastructure, whose disruption could have ripple effects through Boston at large, will be at risk towards the second half of the 21st century. This includes evacuation routes (red lines, e.g. Morrissey Boulevard), MBTA transit stops (T-signs, esp. JFK/UMass and Andrews), schools and utilities.

Master Plan update as critical juncture
As part of this project, I tried to better understand how existing administrative, open data collected by the City of Boston can inform the implementation of climate adaptation strategies by feeding into the Joseph Moakley Park Master Plan update. A design idea contest held by the City of Boston Parks Department last year provides a glimpse at how landscape architects and engineers envision the future design of the park. Some plan to dredge canals into the park and create elevated islands that withstand rising sea levels, others intend to create an elaborate ecosystem with salt marshes and dunes in the Old Harbor area.
The park’s master plan update offers great potential to tie together climate resilience initiatives for the Dorchester Bay that were suggested in the Climate Adaptation Report. The threats posed by flooding and stormwater intrusion are particularly pertinent where natural and built environments border at the park’s edges. In these areas building improvements and green infrastructure installations can effectively complement the climate-proof redesign of the park. Any such initiatives should first and foremost protect the most vulnerable residents. Consequently, priority should be given to increasing climate preparedness of public housing such as of the Mary Ellen McCormack public housing complex along the park’s western flank, whose redevelopment is currently much coveted.
Regulating Climate-Proofing of Building 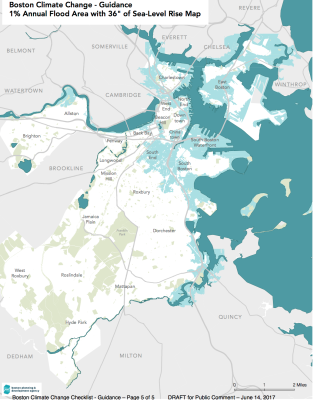
In order to minimize the growing risks associated with water intrusion, strategies such as increasing freeboard, deploying mobile flood barriers and using nature-based solutions to reduce runoff will need to be expanded to areas further away from the shore (for great overview of strategies by A Better City click here). Under Boston’s Green Building and Climate Resilience Guidelines all large building projects now need to achieve a “certified” LEED v4 status, which includes stipulations on achieving minimum levels of groundwater recharge. Furthermore, projects in the one percent annual flood area with 36″ of sea level rise, which includes large swathes around Joseph Moakley Park (see right for BPDA’s latest map), need to implement adaptation strategies to accommodate rising tides.
Analysis of Chronic Dampness/Mold Incidences
In trying to highlight areas that may be particularly prone to water damage and indoor air pollution due to fungus growth in damp conditions, I mapped the reported cases of chronic dampness/mold in any building type in Boston over the period from 2011 to June 2017. Drawing on a cleaned database of all 311 service requests (raw data accessible through Analyze Boston), I filtered out more than 1,700 registered cases Boston-wide with more than 95% of the incidences reported by constituents themselves. Even though the data cannot be interpreted as being a representative snapshot of all cases of water damage in any neighborhood, mapping the places of recorded dampness/mold provides a good starting point to identify blocks and streets struggling with dampness already today.
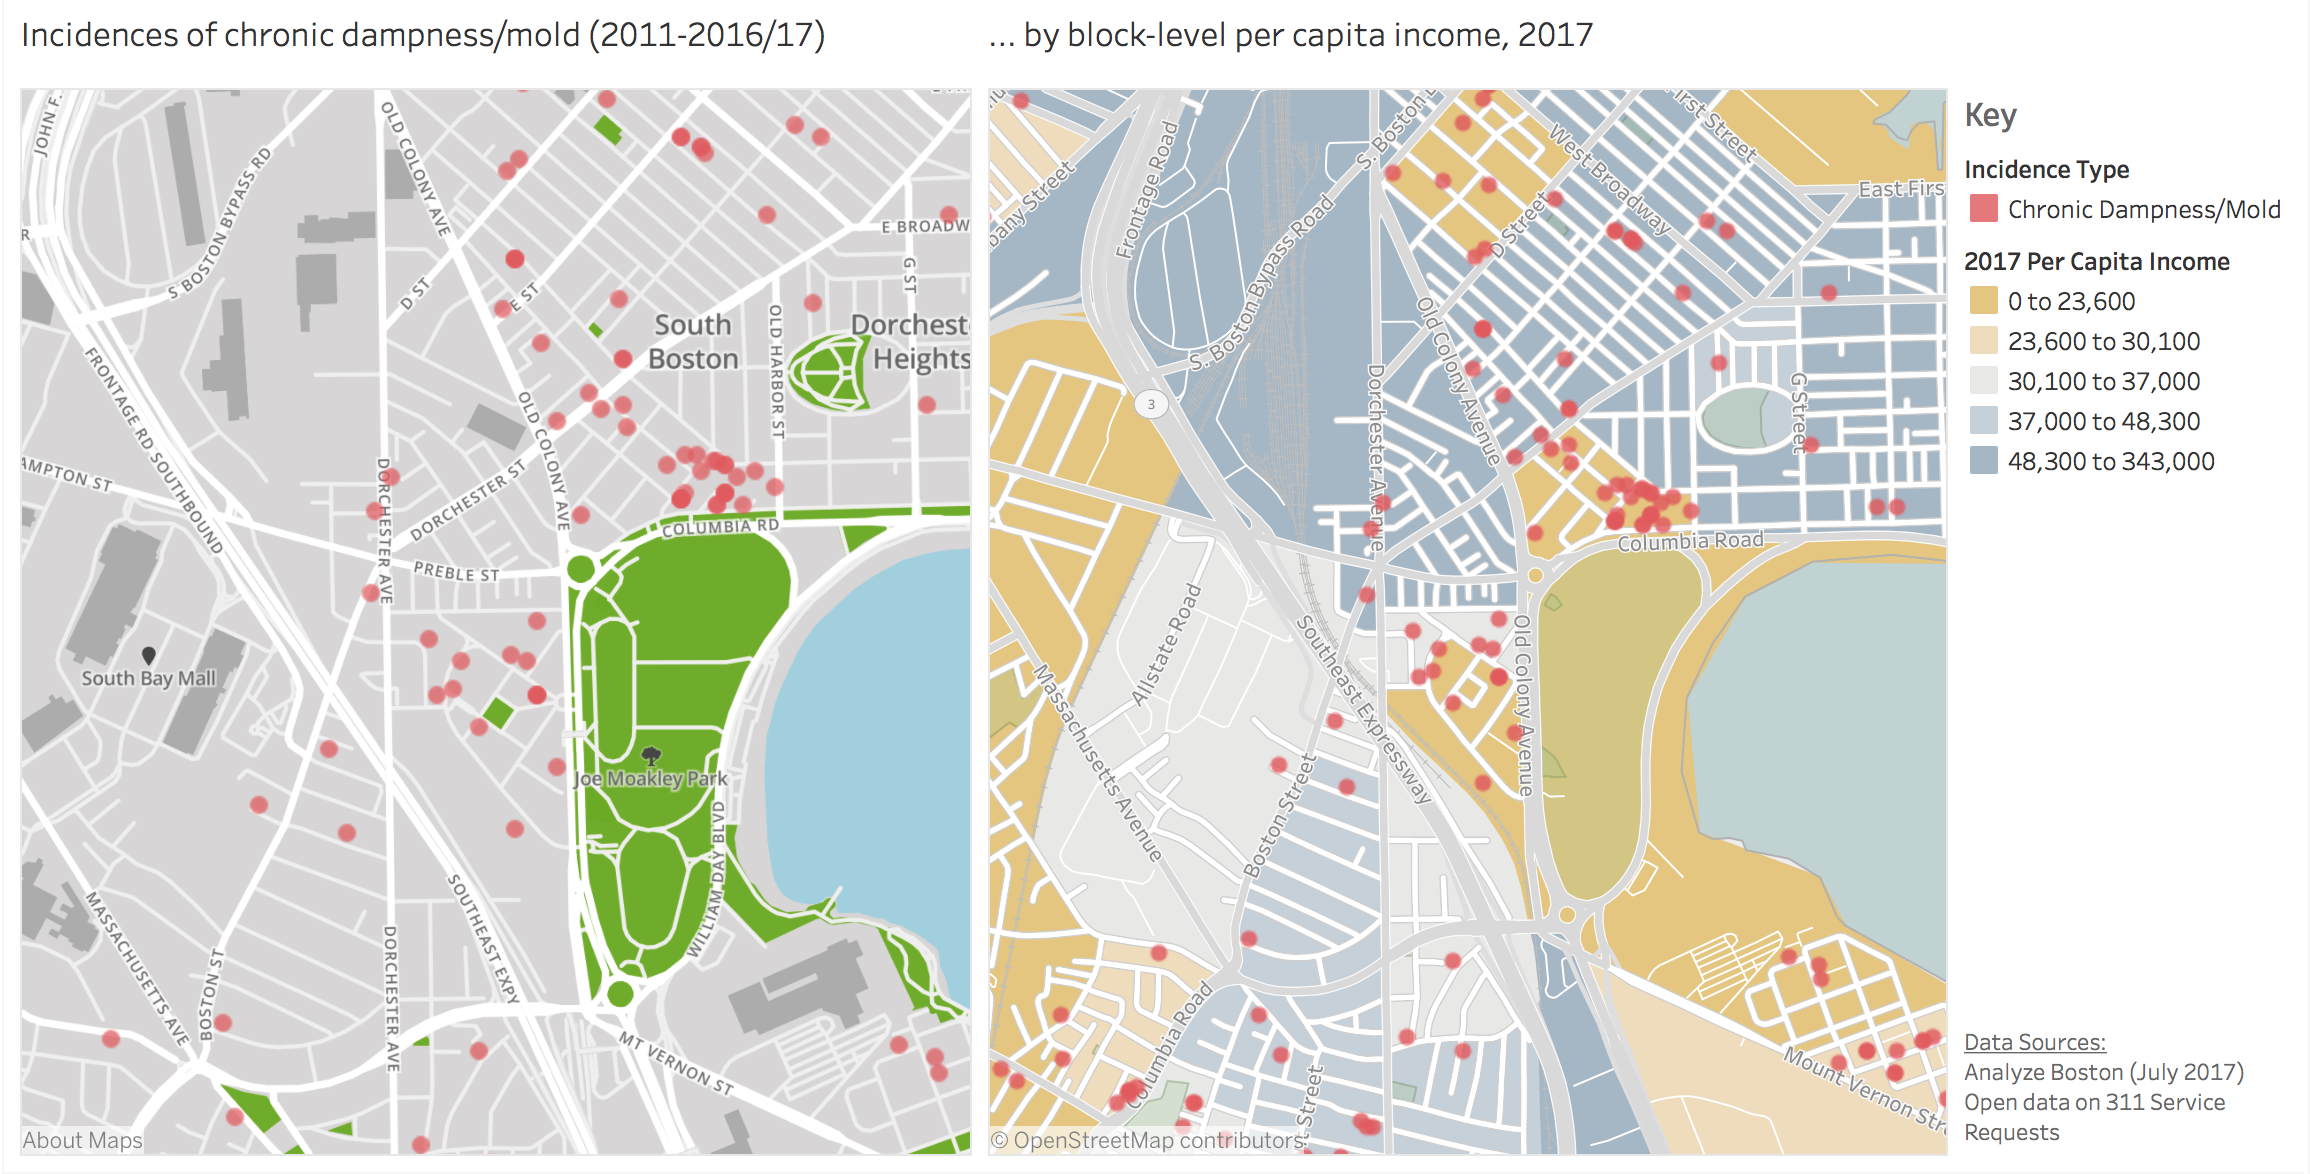
On the two maps above (click here for an interactive version) you can see clusters of reported chronic dampness/mold particularly north of Columbia Road and west of Old Colony Avenue. The buildings on these sites are almost all administered by the Boston Housing Authority. The residents of the (darker) sand yellow-shaded areas have significantly lower per capita incomes than their peers in neighboring blocks. More granular data reveals that the income inequality between one side of the street and the other may be as large as USD 55,000 in some cases with a corresponding median rental difference of more than USD 1,000 per month. Beyond, exposure to chronic dampness/mold is highly correlated with having a majority non-white population. In the north-west of Joe Moakley Park, for instance, the block group immediately surrounding Preble Street, which is 92% White, is completely insulated from dampness/mold, while the block groups bordering it to the south that are predominantly Hispanic, Black and Asian exhibit much greater vulnerability.
Prioritizing Sites for Green Infrastructure Investments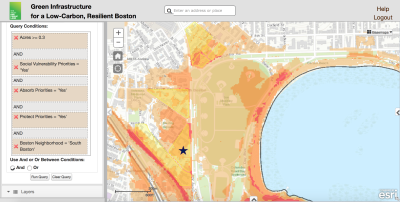
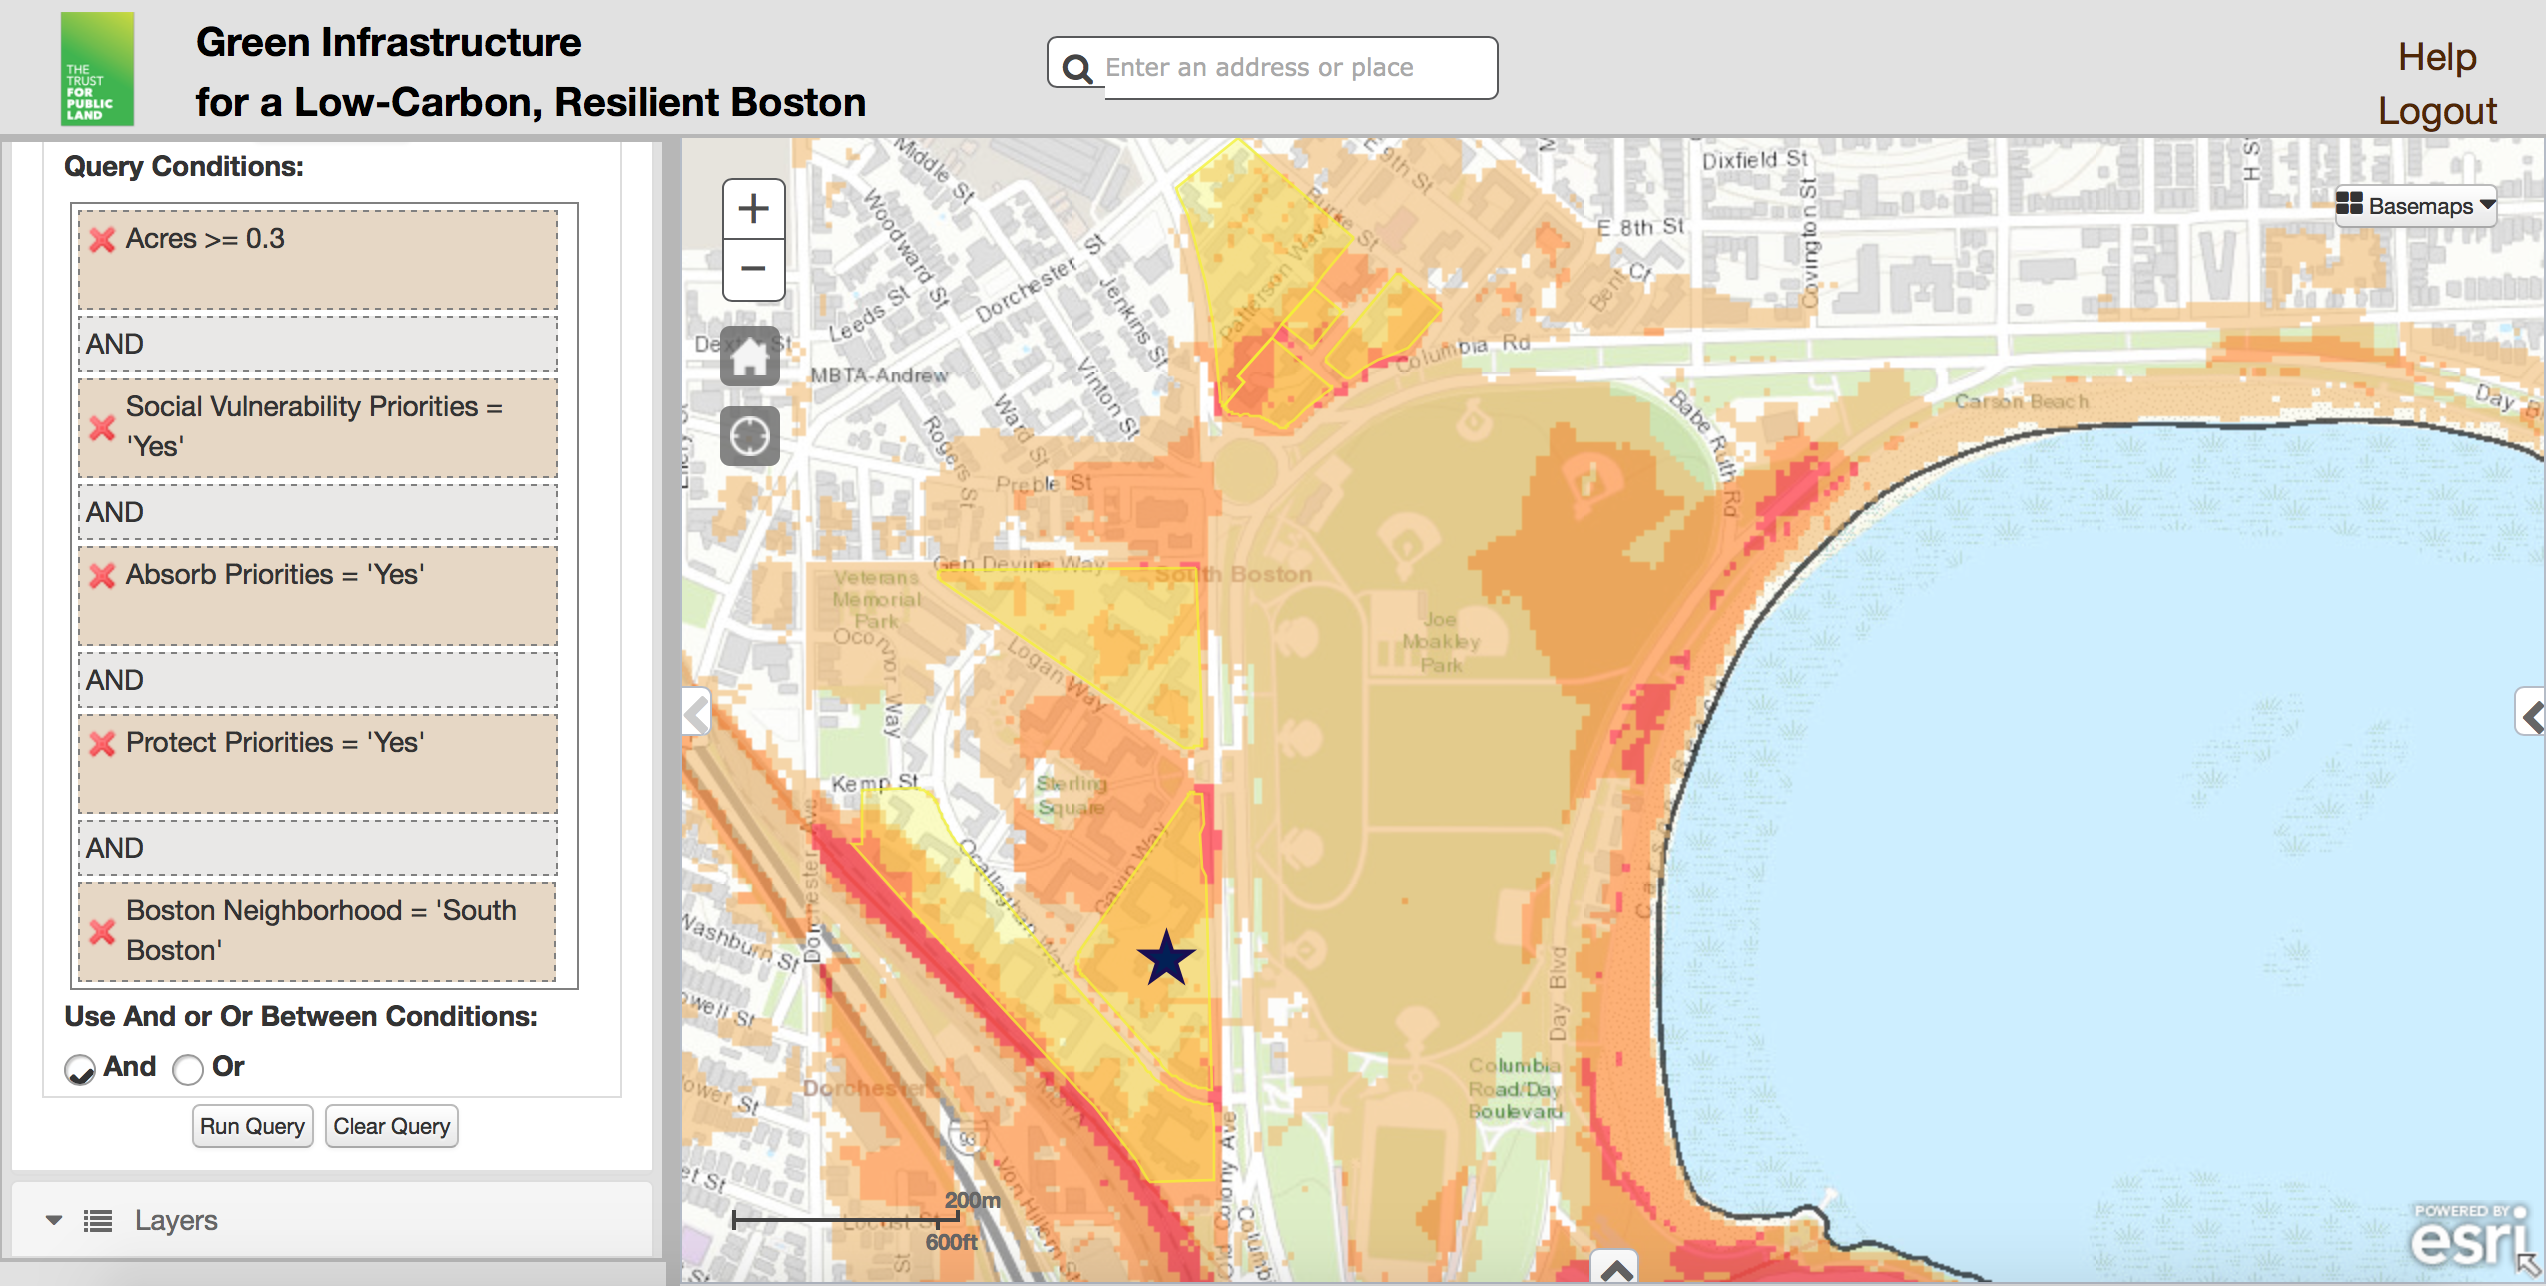
Green infrastructure installations such as rain gardens or green roofs provide a cost-effective way to mitigate the flooding and stormwater runoff risks that are already heightened in these diverse neighborhoods. The Trust for Public Land Green Infrastructure tool allows to prioritize those sites, which are most at risk and lend themselves to the implementation of nature-based solutions. It is noteworthy that the analysis results to the right, which highlight in light yellow the parcels whose location and social fabric of its residents is judged particularly at risk, largely mirror the areas that today already witness high incidences of dampness and mold. At the example of the starred parcel along Old Colony Ave, west of Joe Moakley Park, I will now illustrate the diverse benefits and cost reductions green infrastructure investments may yield.
Benefits and Costs of an Illustrative Green Infrastructure Project
I rely on the Green Values Calculator by the Center for Neighborhood Technology to approximate the effectiveness of a series of best stormwater management practices that could reasonably be implemented at 391-439 Old Colony Ave. The site-specific information that form the basis of the calculations are drawn (and where necessary imputed) from data provided by TPL’s tool, Massachusetts Stormwater Handbook, USDA’s Web Soil Survey and computed with a Google Maps-based area calculator.
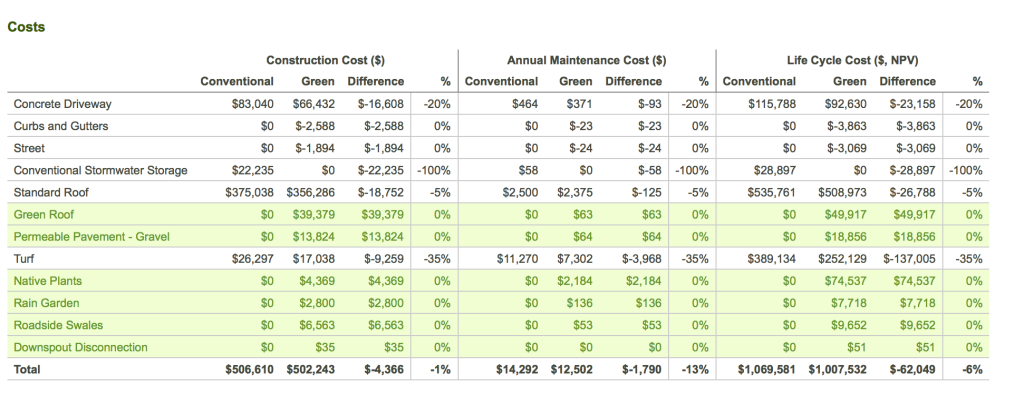
The calculations that follow refer to an exemplary green infrastructure project that entails the green roofing of 5% of the current roofs, the planting of 400 square feet of rain gardens as well as reliance on native vegetation to cover 35% of the permeable surfaces. On top, the project includes the creation of bioswales (150*35ft) as well as the remodeling of 20% of the current concrete alleyways into gravel walkways (all other specifications, e.g for depth of green roofs or porosity of aggregate were kept at their default values).
This mix of interventions yields a total on-site capture of 130% of the required runoff amounts at a 6% total lifecycle cost reduction (includes construction and maintenance) compared to an assumed complete reliance on conventional stormwater storage and treatment to date. In addition, the Green Values Calculator estimates the majority of the benefits to materialize in the form of reduced energy usage (lifetime benefits of ca. USD 14,000). The table below provides a more detailed cost breakdown for this specific project:
Final Observations
Boston’s open 311 service data used in conjunction with climate scenario planning and analytic tools on the viability of green infrastructure offer a startling diagnosis about the exposure to flooding and stormwater risks in the area surrounding Joseph Moakley Park. The ongoing Master Plan update of the park, however, represents a venue through which risk mitigation strategies are explored and agreed upon that should be specifically cognizant of the aggravated impacts on the socially vulnerable populations along the park’s boundaries. Green infrastructure investments present themselves as cost-effective adaptation strategies that can minimize existing and future risks linked to sea level rise and more intense precipitation events. I hope that the case of 391-439 Old Colony Ave, which is administered by the Boston Housing Authority, can start a discussion about green infrastructure investments in some of the most vulnerable neighborhoods in Boston